.svg)

.jpg)
Introduction
In ClinIntell’s latest webinar, Dr. Terrance Govender, Vice President of Medical Affairs, addressed a question many hospital leaders are asking: Why are our GPO performance scores stagnating, even when care quality is strong?
For quality officers, physician leaders, and CDI professionals, the answer was eye-opening. Dr. Govender showed how much of a hospital’s GPO performance isn’t about how care is delivered but about how accurately that care is documented and reported. Through engaging visuals and relatable examples based on actual claims level data, he demonstrated how population-level analytics and clear physician engagement can sustainably close performance gaps that have long felt out of reach.
1. GPO Scores Reflect Documentation Accuracy More Than Care Delivery
Dr. Govender opened the session with a simple truth: You can’t improve what you can’t see. If patient complexity isn’t fully captured across a cohort, the data used for benchmarking will always understate the severity of illness.
“If your documentation doesn’t represent your patient’s true complexity, your GPO scores may never represent your true performance,” he said.
This distinction matters because care teams can be excellent clinically but still appear average on paper. Improving documentation accuracy of specific risk variables often leads to better scores via improved risk adjustment reporting, without changing a single aspect of care delivery.
2. Seeing the Whole Picture Through Population-Level Analytics
Most CDI programs and severity capture tools are built around chart review. Dr. Govender compared this approach to examining a forest one tree at a time, explaining that it’s easy to lose sight of the overall pattern. He introduced the concept of population-level analytics, which helps leaders visualize documentation trends and assess performance relative to expected values across service lines, physicians, and clinical conditions.
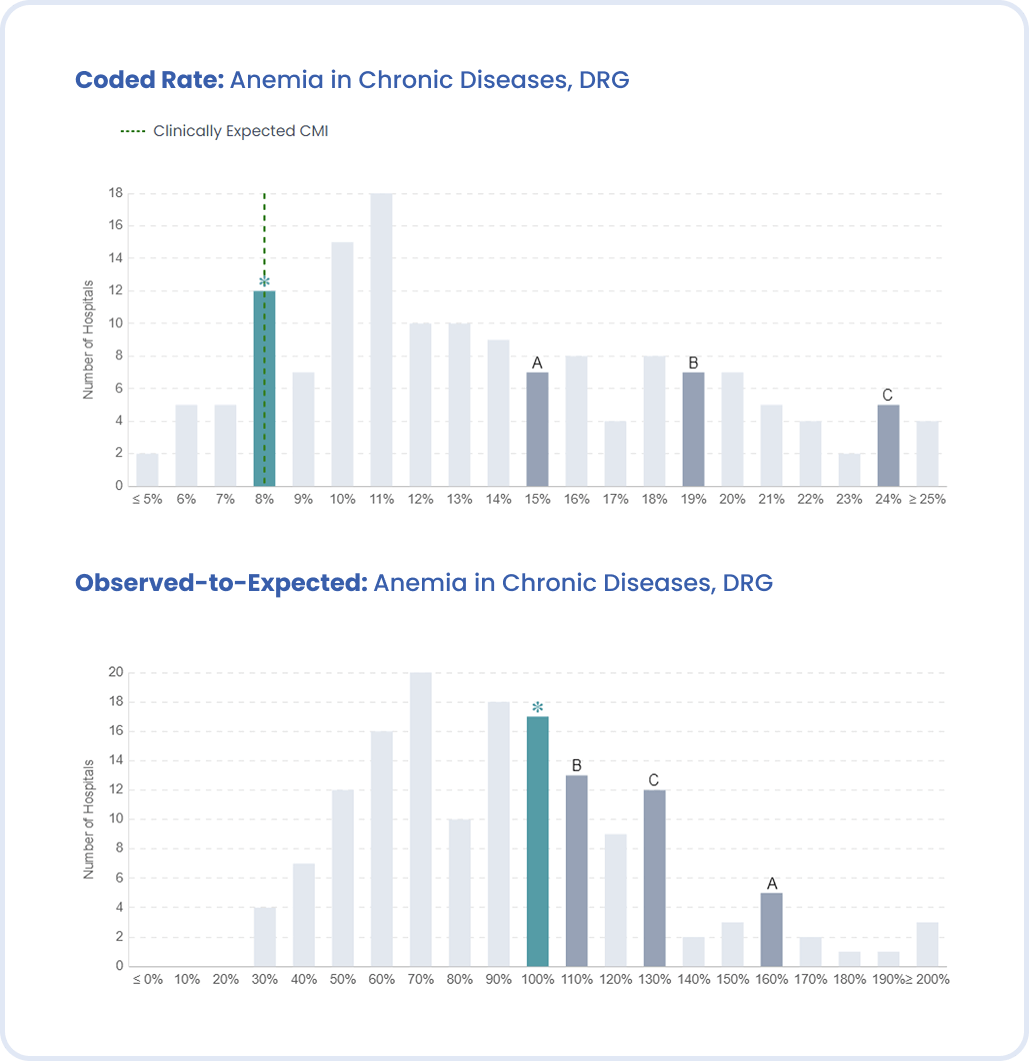
To bring this to life, Dr. Govender showed a bell-curve visualization comparing coded rates of specific clinical conditions across hospitals. The image made an immediate impact. Instead of focusing on averages, it revealed where an organization truly stands within the national distribution, whether it falls in the expected range or stands out as an outlier that deserves closer attention.
This broader perspective enables organizations to identify not only where they are missing opportunities, but also where certain coding patterns might raise compliance questions.
“Averages can be deceptive,” he explained. “When everyone keeps adding more codes, the curve shifts, and you start chasing a moving target.”
3. Understanding Predicted Prevalence
Dr. Govender described a common pitfall via the Easter-egg hunt analogy. Teams chase the highest-value diagnoses without understanding how common those conditions actually are in their population. The result is inconsistent performance, compliance risks, and wasted effort.
Instead, he advised combining two factors: the gap between the predicted prevalence (how often a condition should appear, given your patient mix) and actual coded rate (how often it does appear), and the coefficient value of that condition relative to the specific risk adjustment model. When combined, those two numbers reveal precisely where the biggest, most compliant improvement opportunities exist.
Once that clinical condition opportunity is known, CDI leaders can prioritize the handful of conditions that truly move GPO scores rather than spreading resources thin across dozens of minor ones.
4. Real-World Examples: When the Data Tells the Story
Anemia in Chronic Diseases
Using national data, Dr. Govender showed how one hospital that appeared average in a peer comparison was actually documenting exactly as predicted for its population. Another system, however, coded anemia far more frequently than predicted, landing on the far right of the curve. The key insight: benchmark against your own predicted prevalence, not against outliers.
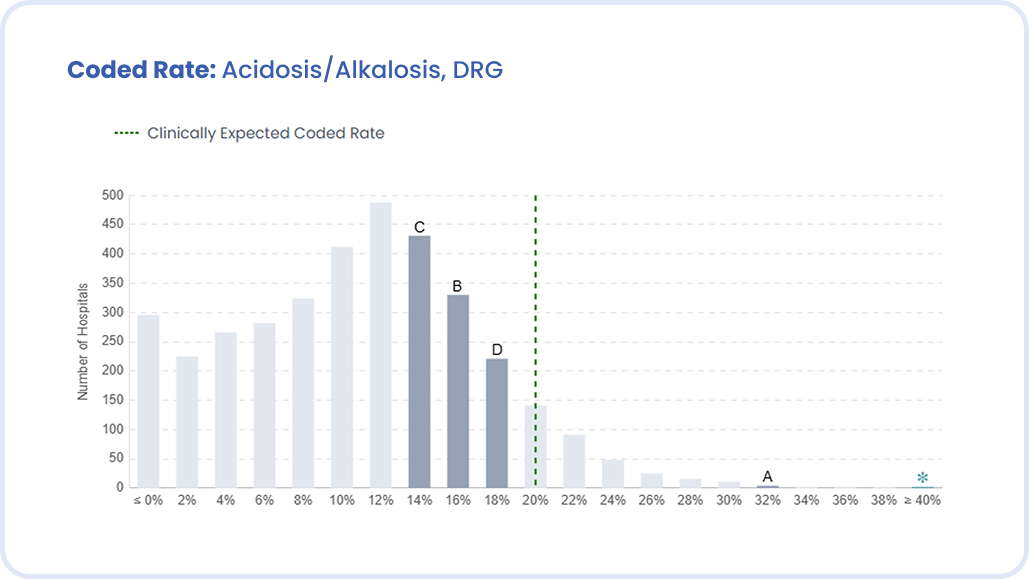
Acidosis and Alkalosis
In another example, one organization’s coded rate of acidosis and alkalosis climbed so high it had to be plotted off the scale of the bell-shaped curve. The image below illustrated how easy it is to drift into over-documentation when the focus is simply catching up to peers.
Dr. Govender made it clear that these visuals aren’t about finger-pointing. They’re about awareness. When leaders can see their data distribution, they can separate genuine clinical variance from potential over or under-documentation.
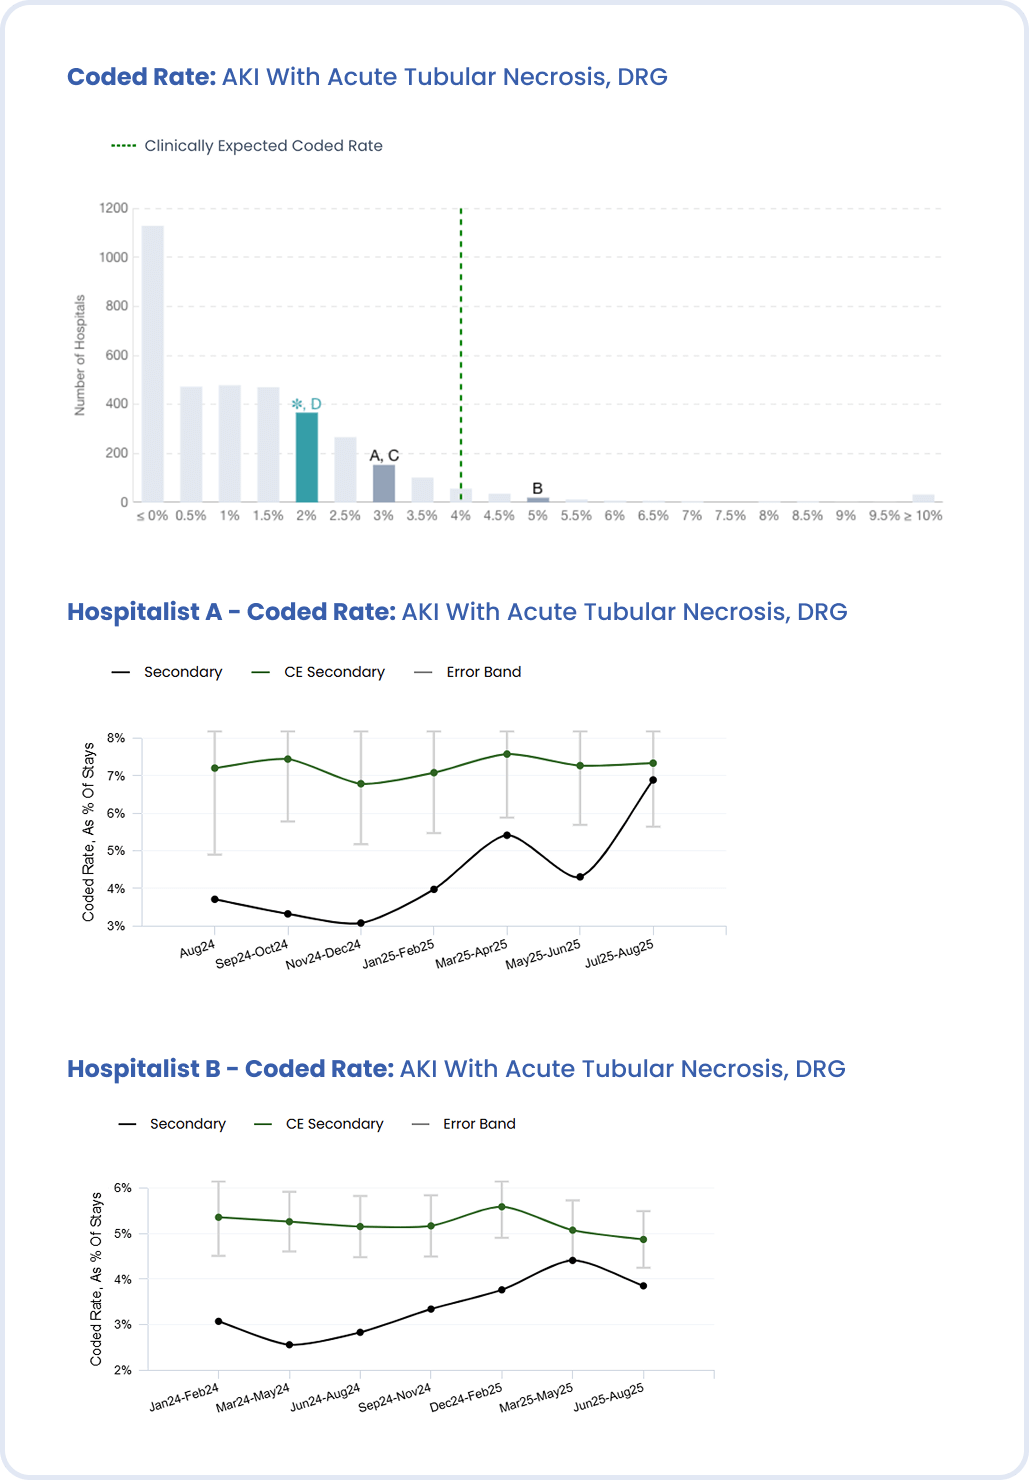
AKI with Acute Tubular Necrosis (ATN)
Perhaps the most actionable example involved acute tubular necrosis. Despite its significant impact on mortality and reimbursement, ATN was under-documented in many organizations. By drilling down into service-line-level data, Dr. Govender showed how identifying the specific physicians and teams driving the gap allows for focused education, clarifying diagnostic criteria and what evidence supports the condition.
After targeted feedback, documentation moved toward the expected prevalence without overshooting it, creating a model for sustainable improvement.
5. Engaging Physicians and Executives in the Same Conversation
Throughout the webinar, Dr. Govender underscored that sustainable success depends on engagement from both physicians and executives.
- Physicians need more than prompts or queries; they need clear, data-driven feedback that connects documentation accuracy to patient outcomes. When physicians see their own data compared to predicted prevalence and peer performance, the insight becomes meaningful. It validates their clinical judgment and encourages proactive documentation rather than reactive correction. Dr. Govender emphasized that when clinicians understand that better documentation supports better metrics, fewer denials, and more accurate public reporting, participation grows naturally.
- Executives must see documentation integrity as an enterprise performance issue. They are responsible for setting priorities, allocating resources, and defining what success looks like. When quality, finance, and medical leadership share the same data view, CDI becomes a cross-functional conversation rather than a siloed initiative. Executive visibility ensures that progress is measured not only by capture rates or query volume but by its impact on organizational stability, compliance, and quality ratings.
Dr. Govender explained that the most successful organizations have learned to create alignment between these two groups. Physicians are empowered with actionable insights that make their documentation more reflective of reality, and executives have the data they need to track enterprise-level results. Together, they turn documentation into a shared responsibility, one that strengthens culture, improves transparency, and sustains measurable outcomes.
“CDI isn’t a back-office function anymore,” Dr. Govender said. “It’s a performance lever for the entire organization.”
By aligning these perspectives, health systems can shift from reactive queries to proactive documentation improvement and from chasing scores to understanding them.
Additional Resources
- CDI in 2025: The Three Trends Leaders Can’t Ignore
- How WVU Medicine Closed the Malnutrition Documentation Gap
- Contact ClinIntell to learn how population-driven analytics can clarify your organization’s predicted vs. observed performance.
Conclusion
GPO scores improve when documentation reflects reality. As Dr. Govender demonstrated, histograms reveal where your organization truly stands, predicted prevalence defines what’s expected, and focused physician engagement drives sustainable change.
Improving performance isn’t just about documenting and coding more. It’s about documenting and coding the most impactful conditions accurately, confidently, and compliantly.
Watch the full webinar on-demand to see how ClinIntell’s population-level analytics help organizations elevate documentation accuracy, reduce query burden, and improve GPO performance.
Schedule Your Free Population-Based Assessment


.jpg)