.svg)



The Question Behind the Analysis
Across a decade of hospital claims data, the same 10 clinical conditions explain why one hospital's MCC capture rate improves while another's stagnates and in every period we tested, no other group of conditions added any statistically significant explanatory power.
For years, ClinIntell has built predictive models to understand what drives hospital-level patient acuity, and a recurring insight from that work is that seemingly complex problems — variation in documentation quality, differences in MCC capture rates across facilities, gaps between expected and actual severity — tend to concentrate in a surprisingly small number of conditions. The analysis described here puts that hypothesis to a rigorous test.
The Study Design
ClinIntell identified all Academic Medical Centers (n = 176) in the country and analyzed their claims data across three distinct time periods: 2016 versus 2019, 2020 versus 2022, and 2023 versus 2025. For each hospital and each period, ClinIntell measured the change in how frequently conditions from three defined groups appeared on claims, then regressed those changes against the change in the hospital’s MCC capture rate.
The three condition groups were constructed as follows:
The first group consists of the 10 clinical conditions that ClinIntell’s prior research identified as the highest-impact drivers of hospital-level CMI severity. These 10 conditions span just 164 MCC-designated ICD-10 codes under the FY2026 IPPS program — approximately 5% of the 3,354 total MCC codes in the ICD-10 code set.
The second group consists of the next 30 most impactful conditions on CMI severity in ClinIntell’s database.
The third group consists of the remaining 96 conditions in ClinIntell’s clinical database that carry measurable impact on CMI severity.
Together, the three groups represent ClinIntell’s full library of non-overlapping severity-relevant clinical conditions. The regression model tests whether changes in coded frequency across each group predict changes in a hospital’s MCC capture rate.
The Finding
The results are consistent across every time period analyzed.
In each regression, the change in average coding frequency for the top 10 conditions is the only statistically significant predictor of change in MCC capture rate. The next 30 conditions and the remaining 96 conditions are not statistically significant in any period.
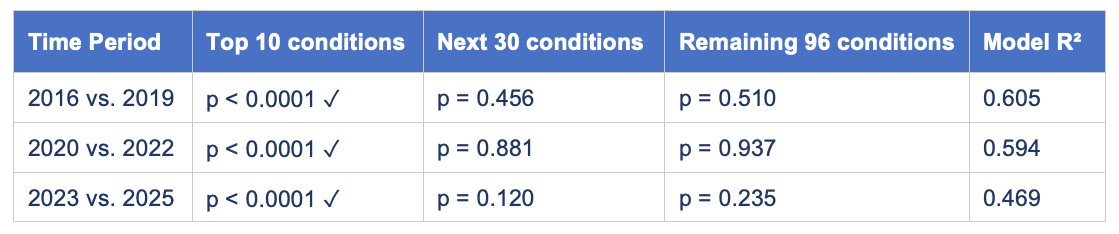
The coefficient on the top 10 conditions is positive and stable across periods — ranging from 0.244 to 0.331 — meaning that each incremental increase in the average number of top 10 conditions coded per claim corresponds to a meaningful improvement in the hospital’s MCC capture rate. The coefficients on the next 30 and remaining 96 conditions are statistically indistinguishable from zero in every period. While overall model fit has somewhat declined over time (R² of 0.605 → 0.594 → 0.469), the conclusion holds: the top 10 conditions remain the only significant predictor in every period.
Stated plainly: changes in how frequently the top 10 conditions are documented and coded account for nearly all of the explained variation in the change in MCC capture rate. All other conditions combined add no statistically significant explanatory power.
.png)
Figure 1. Change in avg. top 10 conditions coded per claim vs. change in MCC capture rate — 176 AMCs, 2023 vs. 2025
The Ten Conditions
The 10 clinical conditions that carry this explanatory weight and the number of ICD-10 MCC codes associated with each under FY2026 are:
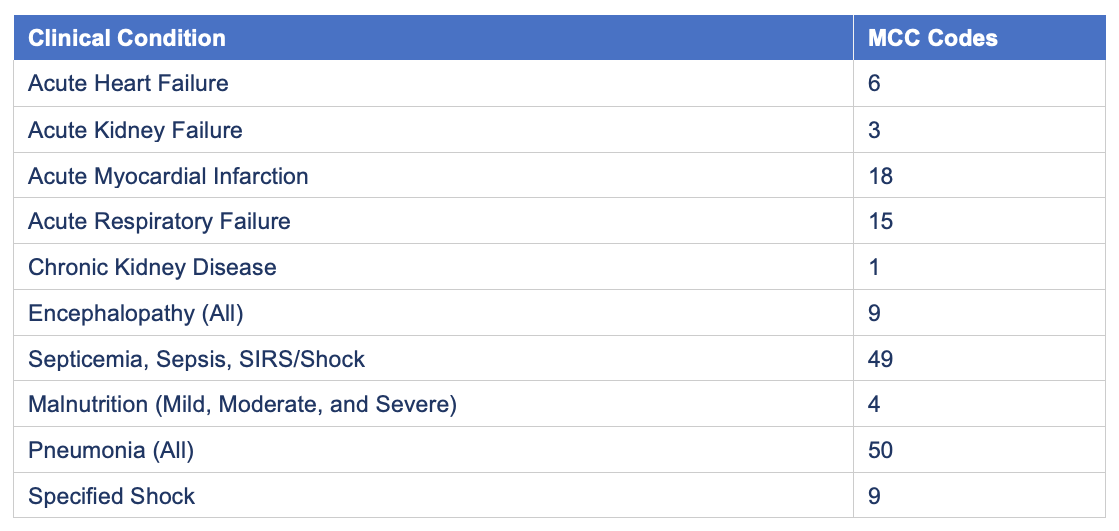
Together, these conditions account for 164 MCC codes — roughly 5% of all MCC-designated diagnoses in the ICD-10 code set. Each represents a clinical condition that is both common in the inpatient setting and sensitive to documentation specificity. Sepsis, pneumonia, and encephalopathy in particular encompass a wide range of ICD-10 specificity options, and the difference between a coded encounter that carries MCC weight and one that does not can come down to terminology used in the physician’s documentation.
What This Means for CDI Strategy
The conventional CDI model deploys specialists to review charts broadly, flagging opportunities across a wide diagnostic spectrum. The data suggest that much of this investment is directed at conditions that have no measurable impact on MCC capture rate. ClinIntell has found that a strategy that focuses on a short list of these MCC conditions with key hospitalist and internal medicine groups has resulted in sustainable behavioral change on the condition in some of the highest facility-level MCC capture rates in the country.
The implication for physician engagement is equally direct. Hospitals that improve upfront documentation for acute respiratory failure, sepsis, malnutrition, and their counterparts on this list could enjoy the benefits of sustainable behavioral change and a reduction in query volume for these conditions. This enables the CDI program to shift from being a crutch to a safety net for the most common conditions and redirect its activity toward less common conditions that may be essential to accurately reporting severity of illness for certain patients.
The Broader Pattern
The analysis spans a full decade of actual claims data and found the same result pre, during, and post pandemic. It appears to be a structural feature of how inpatient population severity of illness lines up with the construction of the MS-DRG system.
Want to know where your hospital stands on the 10 conditions that actually drive MCC capture? Request a facility-level analysis from ClinIntell and see exactly where your documentation investment will have the greatest measurable impact.
Schedule Your Free Population-Based Assessment